Venezuela is probably sliding into a period of hyperinflation, says the Cato Institute’s Steve Hanke. A picture in a recent blog post of his pretty much tells the story:

The economic crisis of which this inflationary spiral is just one part has lots of people wondering how long Venezuela’s president, Nicolás Maduro, can hang on to power. Historical evidence on what happens to political leaders during periods of hyperinflation could give us a good starting point for hazarding a prediction on that matter. Best I can tell, though, this isn’t something that’s been studied before, so I decided to scrounge up some some data and take a look.
I started with a table Hanke and Nicolas Krus published in 2012 that identifies all episodes of hyperinflation around the world since the late eighteenth century (here). By their definition, a hyperinflationary episode starts when there is a month in which prices increase by at least 50%, and it ends when the inflation rate drops below that threshold and then stays under it for at least a year. Their table identifies when each episode began and ended and the peak and average daily inflation rates involved. The good news is that this data set exists. The bad news is that it is only posted in PDF form, so I had to type it into a spreadsheet to start working with it.
According to Hanke and Krus’ table, there have been more than 50 spells of hyperinflation around the world in the past couple of centuries. As the plot below shows, virtually all of those occurred the past 100 years in three clusters: one in the 1920s, another in the 1940s, and the last and by far the largest in the 1990s following the disintegration of the USSR and Yugoslavia.

Hyperinflation Episodes around the World, 1790-2012
The duration of those episodes has varied widely, from a few months or less (many cases) to more than five years (Nicaragua from 1986 until 1991). As you can see in the histogram below, the distribution of durations seems to be bimodal. Most episodes end quickly, but the ones that don’t usually go on to last at least two or three years.
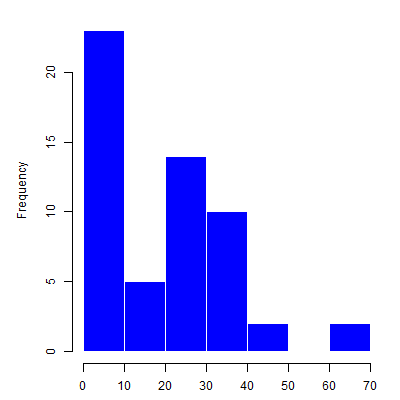
Duration of Hyperinflation Episodes, in Months
The average daily rate of inflation in those episodes has varied much less. As the next histogram shows, nearly all of the episodes have involved average daily rates in the low single digits. Cases like Zimbabwe in 2007-2008, when the daily inflation rate averaged nearly 100% (!), are quite rare.

Average Daily Inflation Rates during Episodes of Hyperinflation
To analyze the fate of political leaders during these episodes, I used the Archigos data set to create a variable indicating whether or not a country’s chief executive was replaced during or soon after the episode of hyperinflation. Suspecting that those fates would depend, in part, on the nature of a country’s national political regime, I also used a data set I created in a past professional life to add a variable marking whether or not a country’s political regime was democratic when the episode started.
A quick look at a contingency table confirmed my hunches that political leaders often lose their jobs during periods of hyperinflation, but also that the pattern differs across democracies and autocracies. Of the 49 episodes that occurred in cases for which I also had data on leaders’ fates and regime type, leadership changes occurred during or soon after 18 of them (37 percent). Eleven of those changes occurred in the 23 cases that were democracies at the time (48 percent). The other seven leader changes came from the 26 episodes that occurred under authoritarian regimes (27 percent). Based on those data alone, it looks like chief executives in democracies are about as likely to lose their jobs during a hyperinflationary episode as they are to hang on to them, while autocrats face more favorable odds of political survival of roughly 3:1.
Of course, the episodes of hyperinflation aren’t identical. As we saw above, some last a lot longer than others, and some involve much steeper inflation rates. To get a sense of how those things affect the fate of the leaders who preside over these dismal spells, I used the ‘glm‘ command in R to estimate a logistic regression model with my binary leadership-change indicator as the outcome and democracy, episode duration, and average daily inflation rate as the covariates. Guessing that the effects of the latter two covariates might be mediated by regime type, I also included interaction terms representing the products of my democracy indicator and those other two variables.
The model is admittedly crude,* but I think the results are still interesting. According to my estimates, the severity of the episode isn’t systematically associated with variation in the fate of national leaders in either type of political regime. For both democracies and autocracies, the substantive effects of the average daily rate over the course of the hyperinflationary episode were roughly zero.
By contrast, the duration of the episode does seem to matter, but only in autocracies. Democratically elected leaders are relatively vulnerable no matter how long the episode lasts. For their part, autocrats aren’t very likely to get knocked out of office during short episodes, but in episodes that persist for a few years, they are about as likely to get tossed as their democratic counterparts. The plot below shows just how bad it gets for autocrats in long-lasting hyperinflationary episodes, assuming average severity. Part of that’s just the additional exposure—the longer the episode, the more likely we are to see a leader exit office for any reason—but the estimated probabilities we see here are much higher than the base rate of leadership change in authoritarian regimes, so it looks like the extended spell of hyperinflation is probably doing some of the work.

Hyperinflation Episode Duration and the Probability of Leadership Change
So what does all this tell us about Maduro’s prospects for political survival, assuming that Venezuela is sliding into a period of hyperinflation? I consider Venezuela’s political regime to be authoritarian, so f I only had these statistics to go by, I would say that Maduro will probably survive the episode, but the chances that he’ll get run out of office will increase the longer the hyperinflation lasts. I’m not an economist, so my best guess at how long Venezuela might suffer under hyperinflation is the average duration from Hanke’s list. That’s a little shy of two years, which would give Maduro odds of about 4:1 to of weathering that storm.
Of course, those statistics aren’t all the information we’ve got. Other things being equal, authoritarian regimes with leaders in their first five years in office—like Venezuela right now—are about three times as likely to transition to democracy as ones with guys who’ve been around for longer, and democratic transitions almost always entail a change at the top. We also know that Maduro so far has been a “boring and muddled” politician, and that there are some doubts about the loyalty he can expect from the military and from other Chavista elites. Putting all of those things together, I’d say that Maduro’s presidency probably won’t last the six years he won in the April 2013 election. Who or what might come next is a whole other question, but as a new leader presiding over an inflationary spiral with weak skills and a shaky coalition, Maduro would seem to have the deck stacked against him.
Data and code for the plots and modeling can be found here and here, respectively.
* To really do this right, I would want to plot survival curves that treat the time from the onset of the hyperinflationary episode to the leader’s exit as the outcome of interest, with right censoring at the episode’s end and regime type as an initial condition. As they say in academese, though, the data preparation that more careful analysis would require was beyond the scope of this blog post. I mean, I’m not Brett Keller.


